![]()
[Support] [Product Info] [Downloads] [Ordering] [Home <www.channld.com/software.html>]
Loudspeaker Frequency Response Measurement
|
The goals include:
In the latter case, equalization for overall response is a reasonable option in moderate size rooms (up to about 15 feet in largest dimension, or somewhat larger rooms with low reverberation). Here, sound reflected from room boundaries will be dominated by the Haas effect. The Haas effect is a psychoacoustic phenomenon whereby sounds from multiple sources are perceived by the listener as coming from a single source, provided that the sound arrivals coincide within 30 milliseconds. Furthermore, the apparent sound source is the source with the first arrival time. Thus, equalization for overall sonic balance succeeds, because the listener cannot distinguish direct and reflected sounds - only their sum, which is perceived as originating at the loudspeaker. Moderate corrections can be made with an equalizer. Properly applied, equalization significantly improves the overall sonic balance of a sound system, minimizing the effect of engineering trade-offs made in the design of the sound system components. Particularly with background music (at any sound level) or non-critical listening situations, equalization artifacts (added noise, distortion or phase nonlinearity, depending on equalizer design) are offset by the general improvement in sonic characteristics. Different equalization settings for each channel (see Case 2) may cause an audio imaging shift, if applied in a critical listening environment. Here, it's best to compromise with equalization settings. For example, use a "common denominator" approach - settings that correspond to the channel with the smallest extremes. Large differences between channels may require other remedies for correction: keep loudspeakers away from reflective surfaces; experiment with loudspeaker placement or sound dampening materials in the listening room.
The instrumentation used:
|
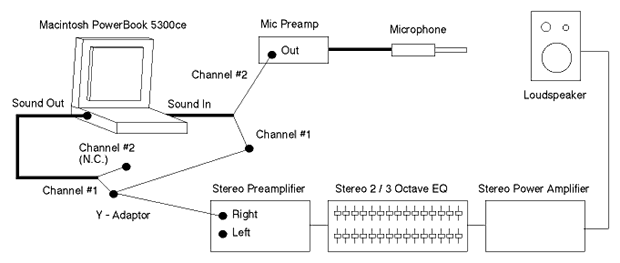 |
| Figure 1. Diagram of the measurement setup. The equalizer was used for Case 2. |
|
Measurement procedure: The electronics were connected as shown in Figure 1. The stereo preamplifier was set to minimum gain.
|
|
Mac the Scope Setup
RTA Setup
|
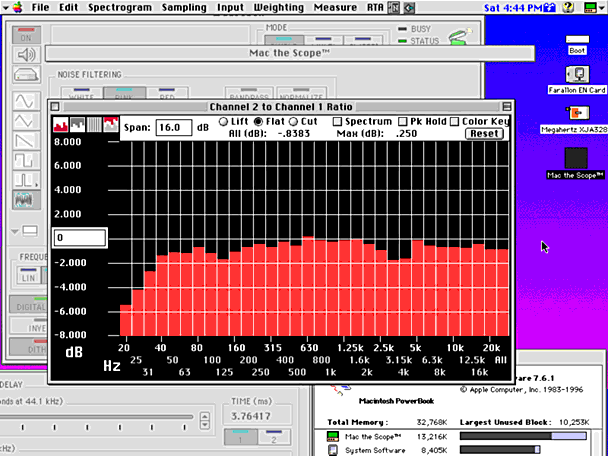 |
| Figure 2. Frequency response measurement of reference loudspeaker (screen grab from PowerBook, reduced to 76%). |
| The computer input and output were connected to determine the signal chain flatness. This ensured that the measured response was due to loudspeaker / room / microphone rather than the measurement system. The PowerBook straight-wire measurement is shown in Figure 3. The manufacturer supplied microphone frequency response curve is shown in Figure 4. |
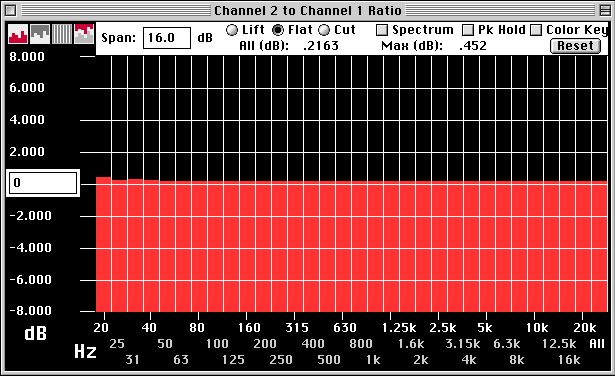 |
| Figure 3. "Straight-Wire" combined frequency response of signal source (PowerBook Sound Out) and measurement (PowerBook Sound In). |
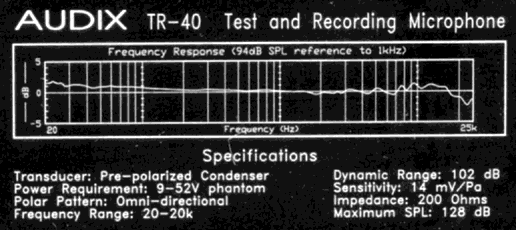 |
| Figure 4. TR-40 microphone, factory response curve (from supplied identification plate). |
 |
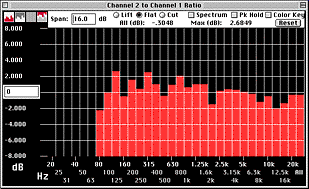 |
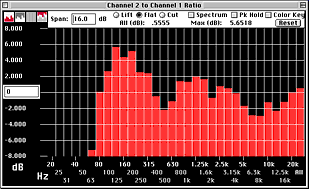
| Figure 5. Baseline loudspeaker response. | Figure 6. Loudspeaker response after equalization. |
| Finally, a subwoofer was connected to extend the low frequency response. Minor adjustments were made to equalization, subwoofer crossover frequency and subwoofer level (results shown in Figure 7). |
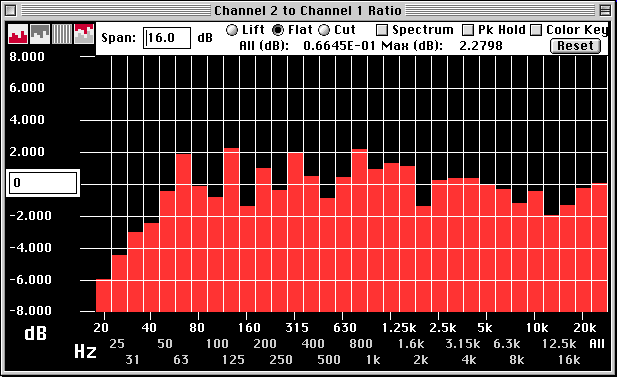 |
| Figure 7. Overall system response, with subwoofer, after equalization. |
|
Summary Purpose: Improving the sonic balance of a medium efficiency, miniature loudspeaker / subwoofer system, with electronic equalization. Result: The measurement system setup and equalization were performed in less than an hour, and the audio system's performance was dramatically improved. Unequalized: +/- 4.5 dB, 80 Hz - 20 kHz Equalized: +/- 2.5 dB, 80 Hz - 20 kHz Equalized, with subwoofer: +/- 2.5 dB, 40 Hz - 20 kHz |
Copyright 1999 Channel D Corp. All Rights Reserved
[Support] [Product Info] [Downloads] [Ordering] [Home <www.channld.com/software.html>]