![]()
[Support] [Product Info] [Downloads] [Ordering] [Home <www.channld.com/software.html>]
Mac the ScopeTM

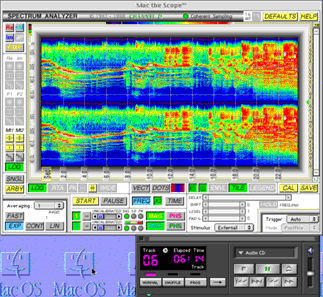
Above illustration: Spectrogram (right and left channels) measured from audio CD input (controlled by the AppleCD Audio Player application). Reduced to 50% of actual size.
Please click on individual images to see enlarged spectrograms ("sonograms") (GIF, 512 x 256 image area; overall size 574 x 273). Spectrograms are between 45 to 75 kB in download size. They show the display and scope "bezel" area, with time and frequency scales. Time=0 begins at the top of the display (frequency axis is oriented horizontally).
(1-5) African lemur (calls and responses) The images represent false-color, false-color 3-D, grayscale, grayscale 3-D, and embossed spectrograms, respectively.
(1-4) Maria Callas (opera arias) The first two images represent false-color and the corresponding 3-D false color spectrograms. The third and fourth are presented in flat false-color.
Music: Macs having video output capability connected to video entertainment systems: "watching" music on video, while listening, adds to the enjoyment (the Mac the Scope color / 3-D spectrogram display is updated in real-time).
(1) George Thorogood (slide guitar and vocal); (2) Mature and juvenile porpoise (dolphin) whistles; (3,4) Skylark (color and grayscale).
[Support] [Product Info] [Downloads] [Ordering] [Home <www.channld.com/software.html>]