![]()
[Support] [Product Info] [Downloads] [Ordering] [Home <www.channld.com/software.html>]
Mac the Scope Signal Chain Measurement Performance
The scope display shown below illustrates signal chain measurement flatness, and the improvements in measurement accuracy obtained from two-channel (Transfer Function) measurements.
Single Channel Measurement:
The measurement is flat within 0.7 dB from 21.5 Hz to 20 kHz (where the Macintosh antialiasing filter begins to attenuate the signal). Note that this includes the flatness of the stimulus source.
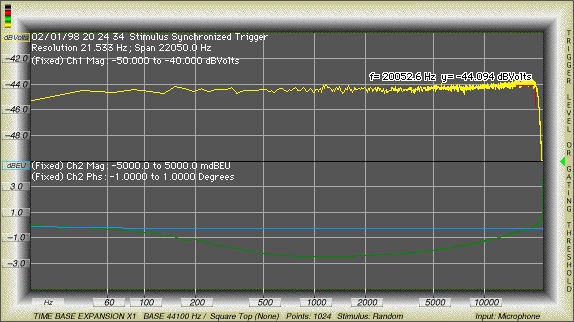
Two Channel (Transfer Function) Measurement:
The transfer function is the blue curve:
Note: the units for the two-channel amplitude trace are reported as dBEU (Engineering Units), because of the implied unit division (Channel 2 dBVolts) / (Channel 1 dBVolts); volts divided by volts results in a "unitless" parameter. Mac the Scope displayed units easily can be changed by the user.
The phase difference between channels is the green curve:
Variations in measured response, using two channels, are due to the system under test (and channel match of the audio interface, which will normally be much tighter than the response of the system under test). One stimulus channel would be used for reference comparisons, and routed directly to the Mac the Scope Channel 1 input. The second channel would be used to drive the system under test, and the response routed to the Mac the Scope Channel 2 input, as shown in an example depicted below.
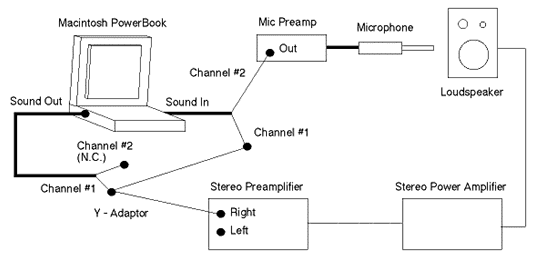
Note: The above diagram is a fanciful depiction of "loudspeaker measurement." In reality, measurement of loudspeaker characteristics is a complex endeavor that is influenced by room / boundary effects.
Typical Calibrated Signal Chain Flatness (20 Hz - 20 kHz, Frequency domain mode, Relative Channel Match, Two Channel Input, With Normalized Magnitude and Phase Difference Trace Math), Mac the Scope Output Stimulus routed to Sound Input:
[Support] [Product Info] [Downloads] [Ordering] [Home <www.channld.com/software.html>]