|
|
|
|
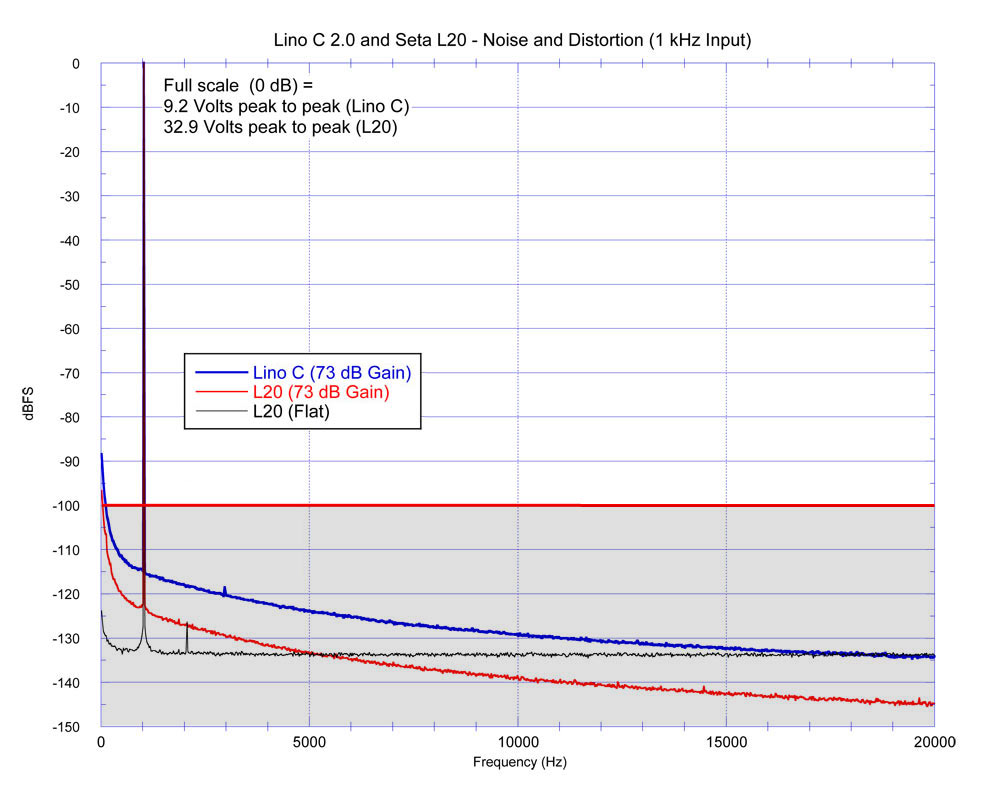
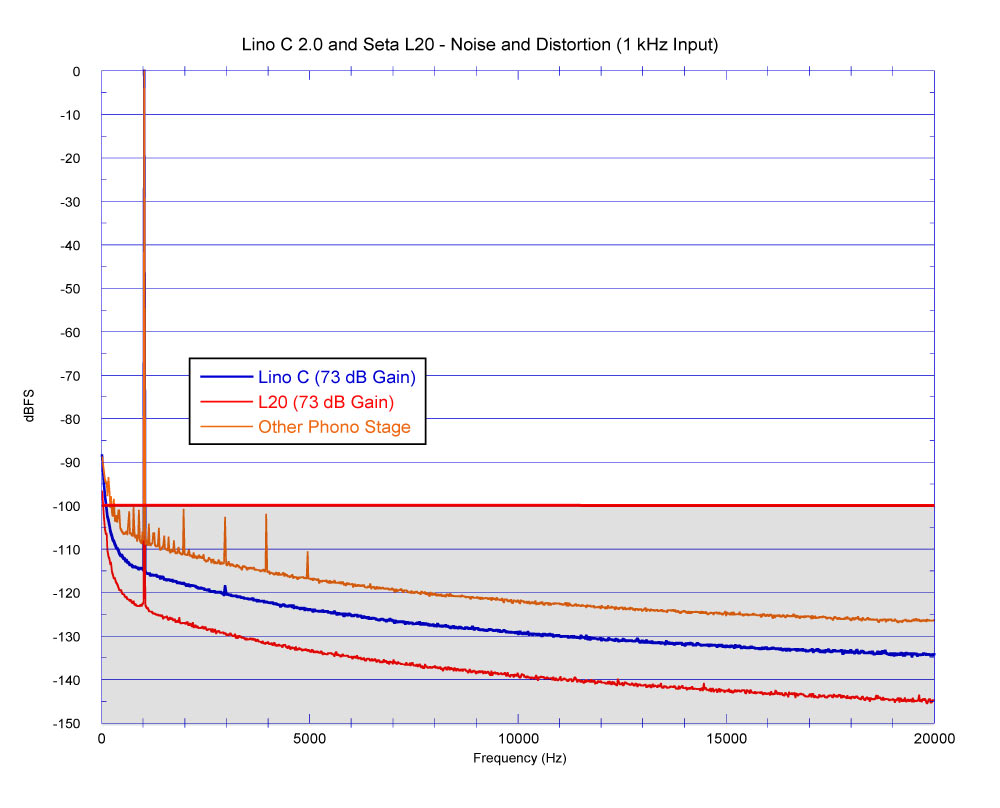
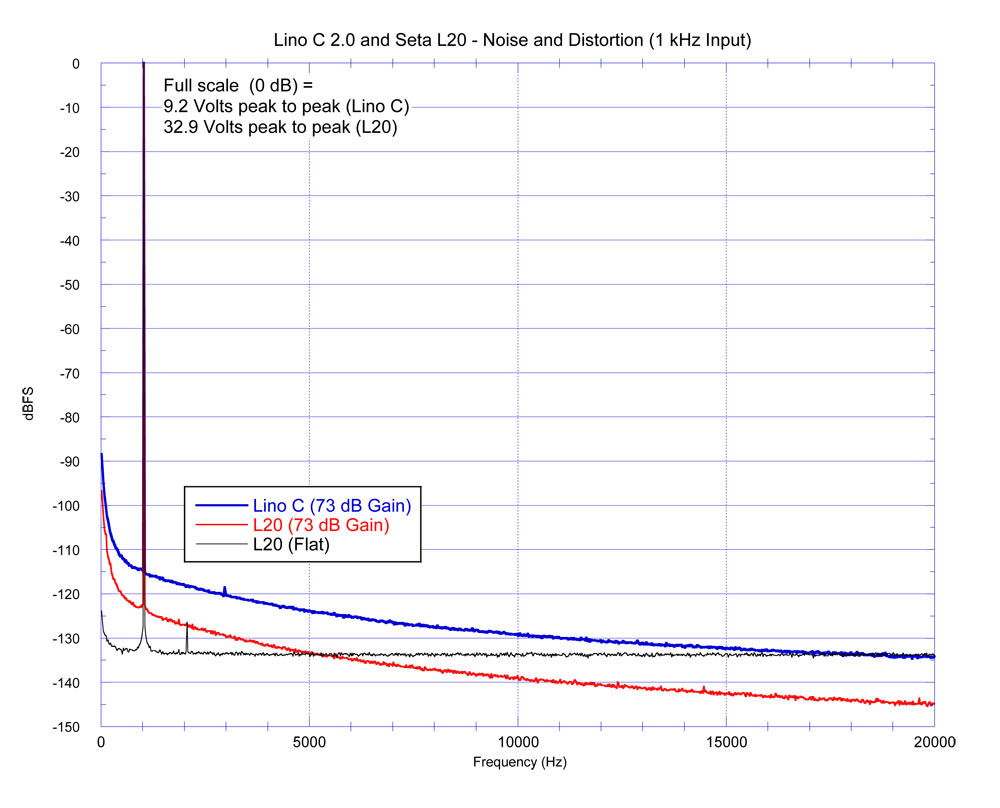
Seta L20 - 1 kHz Distortion and Noise, plus comparison with Lino C 2.0 This shows distortion and noise measurements of the Seta L20 and Lino C 2.0 phono preamplifiers. The blue line is a distortion and noise measurement of our Lino C 2.0 current-mode MC phono stage. There is just a tiny bit of 3rd harmonic distortion; the peak at 3 kHz is at -118.5 dB (0.00012%). The gain of a current-mode (transimpedance) phono stage depends on the impedance of the phono cartridge. The cartridge's output current is amplified, not the voltage. Therefore, lower impedance cartridges will produce higher preamplifier gain. A 6 ohm source impedance was used, typical of most MC cartridges (keep in mind that impedance is not the same thing as load resistance). The Lino C has three settings for gain trim. Set for the middle setting, 73 dB of gain results. While the inexpensive by comparison Lino C fares quite well against the L20, the bandwidth of the Lino C is "only" 200 kHz compared to the 20 megahertz (20 000 kHz) bandwidth of the L20 which confers substantial audible benefits in the audio frequency range (incredible quickness, 3-dimensionality, definition, unveiling of the presentation). These characteristics cannot be determined in a noise and distortion measurement - only in a listening evaluation. But in terms of value, the Lino C obviously holds its own (and reviewers agree)! The L20 output distortion (red line) is undetectable and below the noise floor. The overall noise is 8 to 11 dB less than the Lino C. This is also a torture test for the L20. Notice the L20 output signal level: almost 33 volts peak to peak! The L20 Flat outputs, used with external RIAA (such as with Channel D Pure Vinyl), have a tiny bit of second harmonic at -126.4 dB vs. digital full scale, or 0.000048% (that's four zeros following the decimal point). In other words, less than 0.5 parts per million!* *In actuality, the distortion is even lower than -126.4 dB, since it is close to the level of the noise floor and sums geometrically with the noise, making it seem slightly larger. See this page for a detailed technical explanation. The distortion peak doesn't appear in the RIAA measurement (red line) because the input signal level was lower: In addition to the standard boost and cut at the frequency extremes, the balanced RIAA filter circuit in the L20 also adds 11 dB of overall gain. So, to maintain the same 32.9 volt output level, the input signal was reduced by 11 dB. The Flat signal feeds the RIAA circuit via a signal side chain. At the lower internal Flat signal level, the distortion is slightly lower. To put these measurements in perspective, below is a screen shot of a video frame from Michael Fremer's video coverage (youtube: Analog Planet) of the Munich 2019 audio expo. This happens about 40 minutes into his first day coverage.
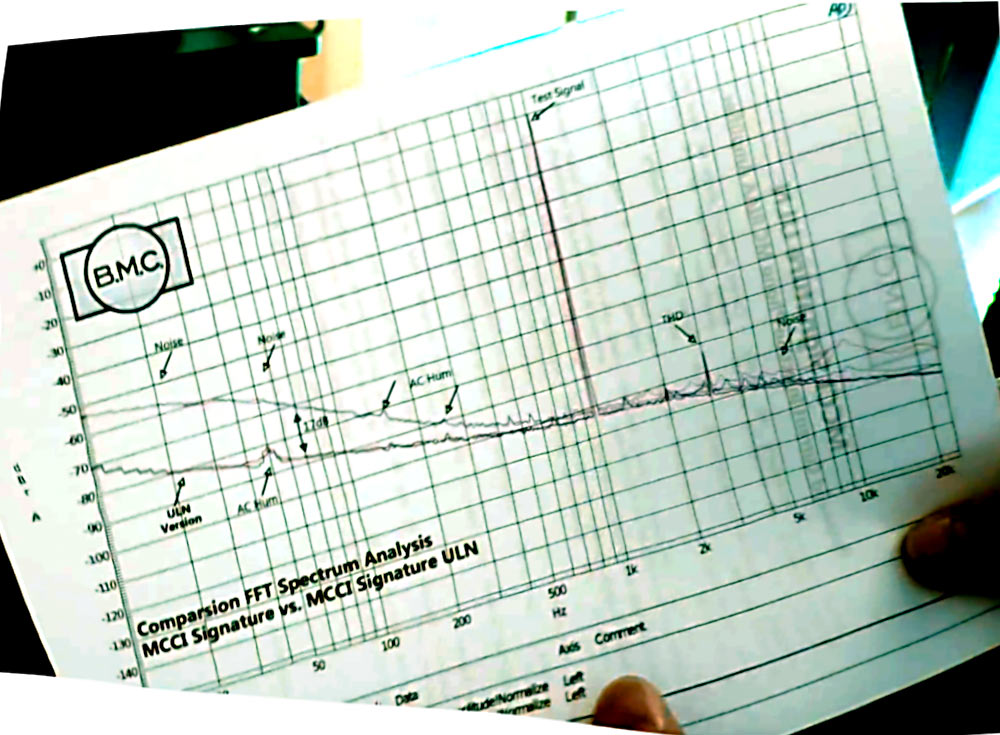
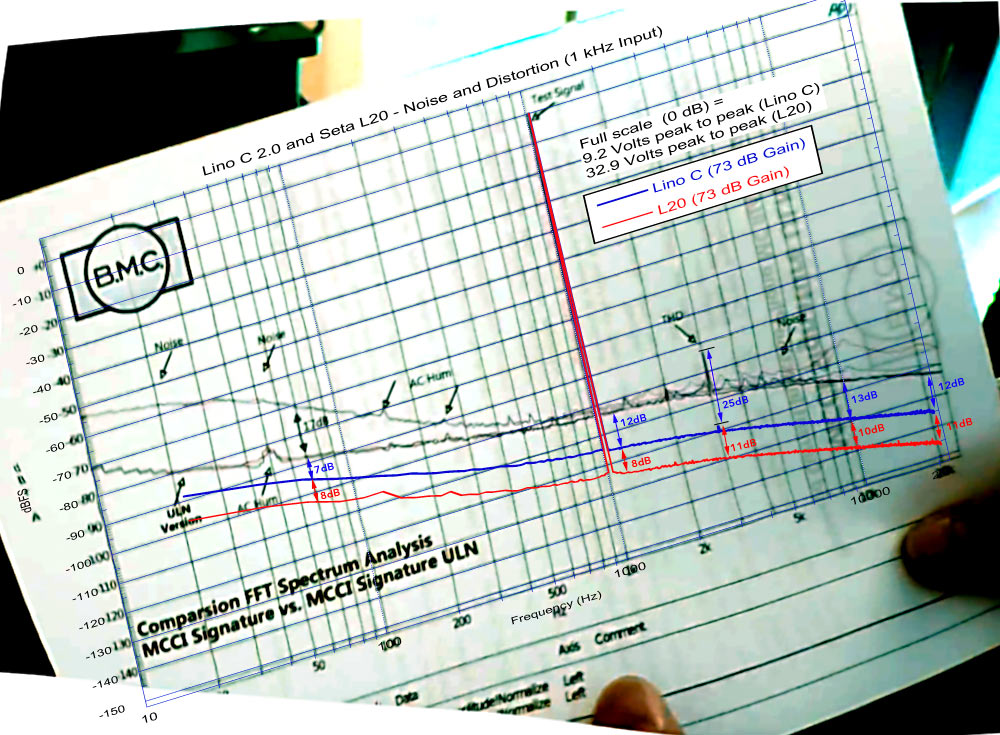
In the video coverage of the show, BMC displayed a graph (made using an audio analyzer made by AP / Audio Precision) of the performance of their phono stage. We replotted our Lino C / L20 distortion and noise graph with a logarithmic frequency axis to match the BMC graph's, and with exactly the same vertical limits of +8 to -152 dB. Note, the "0 dB" grid line is not at the top of the scale, which is above it, at +8 dB; likewise, the lower limit of the scale is 2 dB below the "-150" grid line. Next, the L20 graph was rotated and scaled to match the BMC graph, aligning all of the grids and frequency scale tick marks with the corresponding features on the BMC graph, and placed as an overlay on the screen shot. Lino C 2.0Regarding our Lino C 2.0, note the complete absence of AC hum (blue line). The noise is 7 dB less than the BMC where the improvement of their ULN version is highlighted, and some 12 to 13 dB lower in the midrange and treble.The 3rd harmonic distortion is 25 dB lower than the BMC: compare the "THD" indicated in BMC's graph at 3 kHz to the blue line at 3 kHz. 25 dB is a huge difference. To get an idea of how much 25 dB is, try reducing the playback volume of your audio system by 25 dB. Seta L20The L20 measurement (red line) is an additional 8 to 11 dB quieter than the Lino C. The distortion of the Seta L20 is also at least 11 dB lower; any distortion is below the noise floor, which is 11 dB below the Lino C 3rd harmonic distortion peak.This is not intended as a challenge to BMC; we wanted to put our Lino C and L20 phono stages' performance in perspective by comparing them with another high-end phono stage, after noticing the measurement displayed in Michael Fremer's video. It's difficult to accurately measure distortion at the low levels present in the L20. Since introducing the Seta L20 in 2017, we've devoted considerable effort to developing techniques and hardware for measuring ultra-low distortion levels. For instance, as of early 2019 we are able to measure distortion levels more than an order of magnitude (10 times) lower (better) than equipment used by another manufacturer selling a high-end phono stage in the same price range as the L20. That information is based on a company video tour posted on Michael Fremer's website / YouTube channel showing their electronics lab's test bench setup, with a Prism Sound dScope Series III audio analyzer (this is a different analyzer than what BMC used). The dScope Series III analyzer has a published distortion limit for the input between -105 and -108 dB and for the output of -102 to -104 dB. Taken together as input and output and summing the values geometrically this test kit would be able to measure distortion only as low as -99.8 dB (0.001%, best case based on the -108 dB and -104 dB specifications).
0.001% is a fairly modest measurement specification. In the graph above, a horizontal line and shading has been added at -100 dB (0.001%) corresponding to the dScope Series III's measurement limit. Distortion level measurements in the shaded area are inaccessible to that analyzer. However, our own measurement methods and hardware give us at least "one extra zero" after the decimal point for measurement: better than 0.0001% (-120 dB). "Measures the same" but sounds differentWith an AC voltmeter, one can measure the output voltage level of three different-sounding preamps set to exactly the same gain. Aha - they sound different, but measure the same!A simple output level measurement is technically still "a measurement," but useless in determining anything about the sound quality. That admittedly glib example shows that statements about measurements, to be meaningful, require qualification. When someone states two components "measure identically," it's vital they also explain not only what was measured but also the thoroughness of the measurement itself, or else such a statement is meaningless! This is illustrated in the example below.
We've been developing and improving our own professional audio test and measurement equipment for over 20 years. Rather than purchase an off-the-shelf "distortion measurement kit," we can rely on our own expertise and products for performing this essential product development function. This provides us with a key advantage and the incentive for setting the "performance" bar substantially higher than other manufacturers. The difference is audible. Our phono stages sound great and measure great. Our phono stages measure great and sound great. Links to other Seta L20 measurements
|