Mac the Scope
Multifunction signal analyzer
Mac the Scope Displays & Screen shots
The Console user interface intentionally is designed to resemble a traditional 'scope. Modality is avoided where possible, thanks to the Macintosh user-event-driven paradigm. The scope Console is supplemented, where appropriate, with other configuration panels.
The interface is designed to present the most commonly-used features in a simple, accessible manner. Settings can be changed at will, without having to navigate through a series of menus or dialog boxes. Returning to default settings is an easy, one-click operation, and custom configurations can be saved for quick recall.
Mac the Scope - Device Selection and Properties
The display images were generated by pressing command-S in Mac the Scope, to save the display as a PICT file (for an image of the entire Mac the Scope Console, follow the link provided below). Traces also can be saved as tab-delimited, floating point format TEXT files, by selecting the appropriate options.
Different color schemes are shown. Colors (grids, fill, trace colors, text overprint) easily can be changed in Mac the Scope.
Text overprint (Legend) can be disabled with one click (as can various traces, grids, etc.) The images below only illustrate different display and analysis configurations of the Console.
Dual-channel oscilloscope, overlapped channel display.
Dual-channel oscilloscope, tiled channel display.
Dual-channel oscilloscope, vector scope (x vs. y) display.
Dual-channel spectrum analyzer, tiled display.
Processing a sound file having a sample rate of 500 kHz; signal was a 127 kHz sine wave. Sample rates may extend to over 2 GHz in Sound Designer II format sound files.
Spectrum analyzer, dot envelope display. Envelope display mode causes each new analysis trace to overwrite the previous display (traces accumulate on the display).
Here, dot trace display mode was used in conjunction with a time base expansion of X32 to examine the low frequency content of an audio recording. The recording contained low frequency keyboard bass notes, with appreciable fundamental content down to ca. 25 Hz (frequency resolution was 0.67 Hz).
Spectrum analyzer, transfer function and phase display. Near field frequency and phase (orange curve) response of loudspeaker woofer. Phase peak at ca. 40 Hz is partly due to a peculiarity in the design of the loudspeaker.
Spectrum analyzer, transfer function display. Near field frequency response of loudspeaker woofer.
Spectrum analyzer; imaginary vs. real (a.k.a. complex-plane, Nyquist, Cole-Cole or "polar" plot). Near field complex plane transfer function of loudspeaker woofer. Imaginary part is inverted. Frequency range shown 20 Hz - 1000 Hz (is adjustable). The 1000 Hz data point lies near the origin (0,0).
Spectrum analyzer; transfer function display plus real and imaginary parts of complex transfer function. Near field frequency response, plus real (red) and imaginary (green) parts of complex transfer function of loudspeaker woofer. Cursor positioned on real part to show magnitude (0.8549 engineering units) and frequency.
Spectrum analyzer, 3-D filled live waterfall spectrogram display, single channel, vertical time format, real-time plot of Waavebox frequency sweep, digital mode, 1/2 octave steps. Waavebox was configured for analog emulation mode, with continuous frequency sweep (and click-free output). Sweep range 500 Hz to 2000 Hz, one 1/2 octave step per second. Sound output port connected to sound input port with cable (full-duplex sound generation and monitoring / analysis). Plot dynamic range 100 dB; scale is re: digital full scale.
The first harmonic distortion product (faint trace one octave above the principal sweep peak) is over 90 dB smaller than the amplitude of the fundamental frequency.
Mac the Scope spectrogram display shown.
1/3 octave RTA, showing level and peak hold displays, configured for A-weighted SPL.
RTA display colors easily can be changed. Here, red corresponds to level and blue to peak. The blue bars are "pushed" upwards by the red bars, to record peak levels.
The All level bar can be configured to show the logarithmic mean or logarithmic sum (overall level) of all other bars.
Other available options are different weighting functions, display as a spectrogram, or color key the display bars. The levels of the individual bars (or the overall level) can be logged to a text file every second (or slower); or as a single-shot tab-delimited file.
Microphone sensitivity may be entered and the entire gain structure of Mac the Scope calibrated to accurately display input levels, as SPL or dBV (or dB re: digital full scale, which is not affected by calibration).
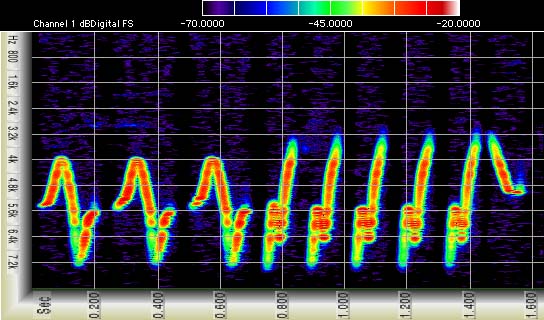
Sonogram generated with Mac the Scope from a yellow warbler wave file
|
Demo
Buy
Mac the Scope 4X version 4.28
Includes Mac the Scope, Waavebox, hyperlinked documentation, example automation scripts
Mac the Scope Reviews
5 out of 5 Rating for Mac the Scope 2.8.2, 3.0.2
Tucows
"Channel D Mac the Scope 2.1: SOFTWARE-BASED TEST INSTRUMENTS"
Mix Magazine - February 1999 issue
Erik Hawkins
Honored with an EQ Audio Engineering Society Blue Ribbon Award nomination at the 107th Audio Engineering Society Convention in New York City."
Audio Engineering Society -
Channel D's Booth at AES Convention
|