Mac the Scope
Multifunction signal analyzer
Mac the Scope Sonograms
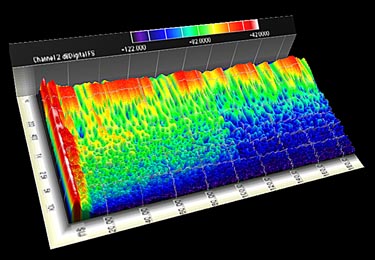
Spectrum analyzer, 3-D filled live waterfall spectrogram display, single channel, vertical time format, real-time plot of Waavebox frequency sweep, digital mode, 1/2 octave steps. Waavebox was configured for analog emulation mode, with continuous frequency sweep (and click-free output). Sweep range 500 Hz to 2000 Hz, one 1/2 octave step per second. Sound output port connected to sound input port with cable (full-duplex sound generation and monitoring / analysis). Plot dynamic range 100 dB; scale is re: digital full scale.
The first harmonic distortion product (faint trace one octave above the principal sweep peak) is over 90 dB smaller than the amplitude of the fundamental frequency.
Mac the Scope spectrogram display shown.
Room impulse response, spectrogram plot, rendered with the included photorealistic renderer Mac the Scope 4.0 (OS 9).
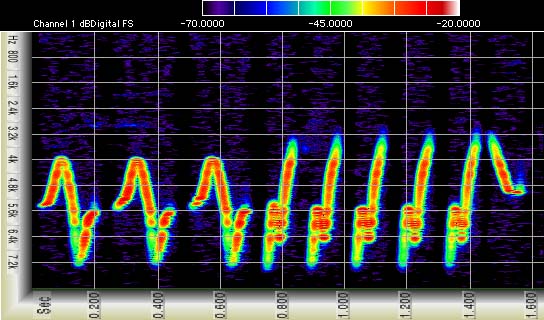
Spectrum analyzer, "top-view" spectrogram display, dual channel, horizontal time format.
Signal amplitude is indicated by color variation.
- Spectrogram is drawn in real-time, from top to bottom or from left to right
- One or two channels may be displayed
- When analyzing sound files, time axis can show absolute time (as above) with time=0 at beginning of file
- Variable overlap can be used to expand the resolution of the time axis (as above; also see the Offline File Processing with Mac the Scope page)
- Trace values can be determined at specific positions with the cursor
- If the cursor position is manually locked ("Measure" menu), the value at a given frequency is updated as the display scrolls past the cursor position
- Color tables (including grayscale) can be modified or automatically inverted
Spectrum analyzer, "top-view" spectrogram display, single channel, horizontal time format, inverted grayscale lookup table. Same as the color spectrogram, except only one channel is analyzed, and an inverted grayscale lookup table was used instead of the false color lookup table.
The "live" cursor was positioned over the display, and shows the amplitude (ca. -48 dB re: digital full scale) and frequency (ca. 3500 Hz) at the cursor measurement point.
Offline File Processing with Mac the Scope. This illustrates using a large amount (90%) of sample overlap to greatly improve the time-axis resolution.
Horizontal - frequency - axis format spectrogram of Maria Callas recording. AIFF file; screen shot reduced to 76%
The wavy traces indicate the distinctive, trademark vibrato (frequency modulation); also note the harmonic richness
Spectrum analyzer, 3-D filled waterfall spectrogram display, single channel, vertical time format, real-time plot of Waavebox frequency sweep, digital mode, 1/2 octave steps.
Waavebox was configured for digital emulation mode, with discrete frequency "sweep" steps. Sweep range 500 Hz to 2000 Hz, one 1/2 octave step per second. Sound output port connected to sound input port with cable (full-duplex sound generation and monitoring / analysis). Plot dynamic range 100 dB; scale is re: digital full scale.
Mac the Scope spectrogram display shown.
Sonogram generated with Mac the Scope from a yellow warbler wave file
Spectrogram (right and left channels) measured from audio CD input (controlled by the AppleCD Audio Player application). Reduced to 50% of actual size.
African lemur (calls and responses) The images represent false-color, false-color 3-D, grayscale, grayscale 3-D, and embossed spectrograms, respectively. Shown is display and scope "bezel" area, with time and frequency scales. Time=0 begins at the top of the display (frequency axis is oriented horizontally).
 Maria Callas (opera arias) The first two images represent false-color and the corresponding 3-D false color spectrograms. The third and fourth are presented in flat false-color. Shown is display and scope "bezel" area, with time and frequency scales. Time=0 begins at the top of the display (frequency axis is oriented horizontally). Music: Macs having video output capability connected to video entertainment systems: "watching" music on video, while listening, adds to the enjoyment (the Mac the Scope color / 3-D spectrogram display is updated in real-time). Maria Callas (opera arias) The first two images represent false-color and the corresponding 3-D false color spectrograms. The third and fourth are presented in flat false-color. Shown is display and scope "bezel" area, with time and frequency scales. Time=0 begins at the top of the display (frequency axis is oriented horizontally). Music: Macs having video output capability connected to video entertainment systems: "watching" music on video, while listening, adds to the enjoyment (the Mac the Scope color / 3-D spectrogram display is updated in real-time).
George Thorogood (slide guitar and vocal)
Mature and juvenile porpoise (dolphin) whistles
Skylark (color)
 Skylark (grayscale) Skylark (grayscale)
|
Demo
Buy
Mac the Scope 4X version 4.28
Includes Mac the Scope, Waavebox, hyperlinked documentation, example automation scripts
Mac the Scope Reviews
5 out of 5 Rating for Mac the Scope 2.8.2, 3.0.2
Tucows
"Channel D Mac the Scope 2.1: SOFTWARE-BASED TEST INSTRUMENTS"
Mix Magazine - February 1999 issue
Erik Hawkins
Honored with an EQ Audio Engineering Society Blue Ribbon Award nomination at the 107th Audio Engineering Society Convention in New York City."
Audio Engineering Society -
Channel D's Booth at AES Convention
|